Neat Sense and Sensor Data Overview
Last updated on August 7th, 2025.
Learn what environmental data Neat devices capture and how IT admins can access it.
Neat devices are equipped with an advanced set of smart room sensor technologies designed to continuously monitor and manage environmental and occupancy conditions. These sensors allow organizations to gain insights into air quality, room usage, and other environmental factors, contributing to improved employee satisfaction, workplace optimization, and productivity.
Neat sensor data is available via the Zoom Dashboard. In parallel, the Neat Pulse platform and its Web API also provide comprehensive access to real-time and historical sensor data. This document outlines the types of sensors in Neat devices, data sampling and reporting mechanisms, as well as integration details for Zoom and Neat Pulse platforms.
Contents
- What sensors are built into Neat devices?
- What happens once Neat sensors have collected the data?
- Accessing and using sensor data
- Breakdown of sensors and measurements
- Zoom Dashboard Integration
- Important Considerations
What sensors are built into Neat devices?
For detailed information on Neat device sensor support, see the table Sensors per device.
Temperature Sensor
Neat devices include a built-in temperature sensor.
- Accuracy: ±1°C within a range of +15°C to +40°C
- Measurement Steps: 0.1°C or 0.1°F
- Unit Selection: You can choose Celsius or Fahrenheit in the Zoom Room Admin Portal
Note: This sensor is not yet supported in the Zoom Room Controller software on Neat Pad.
Note: Neat Bar Generation 2 does not have this sensor. Neat Pad provides the real-time sensors for air quality, temperature and humidity.
Humidity Sensor
Neat devices also measure humidity.
- Accuracy: ±3.5% relative humidity (rH) in the 20%–80% range
- Measurement Steps: 1% rH
Note: This sensor is also not yet supported in the Zoom Room Controller software on Neat Pad.
Note: Neat Bar Generation 2 does not have this sensor. Neat Pad provides the real-time sensors for air quality, temperature and humidity.
Air Quality Sensors (CO2eq and TVOC)
These sensors estimate indoor air quality using:
- TVOC (Total Volatile Organic Compounds): Measures levels from 0 to 60,000 parts per billion (ppb), ±15% accuracy
- CO2eq (Estimated CO2): Based on hydrogen gas, measures from 400 to 60,000 parts per million (ppm), ±15% accuracy
These sensors give a general indication of air quality in standard office environments but are not suitable where actual CO2 measurement is required.
Note: Neat Bar Generation 2 does not have this sensor. Neat Pad provides the real-time sensors for air quality, temperature and humidity.
Important: Devices must be powered on for at least 24 hours to provide reliable readings.
Avoid placing devices near heat sources or in poorly ventilated areas, as this can affect sensor accuracy.
Currently, air quality data is reported to Zoom only from Neat Bar and Neat Board. Neat Pad does not yet send this data to the Zoom cloud.
People Count
Neat devices use built-in computer vision and machine learning to detect how many people are in the room.
- Privacy: No biometric data is collected or stored
- Data Use: Only the total number of people is sent to the Zoom cloud
- Control: You can enable or disable this feature in the Zoom Room Admin Portal under Zoom Rooms Account Settings
What happens once Neat sensors have collected the data?
You have the opportunity to view the information live through Zoom Dashboard as well as your Neat device. Neat sensors regularly send data to the Zoom cloud. Once the data is received, Zoom processes this information to provide user-friendly graphics through the Dashboard.
Once you find your room under Zoom Rooms (in Dashboard), select and open the room and you will find a short summary about the various sensor data collected from the room.

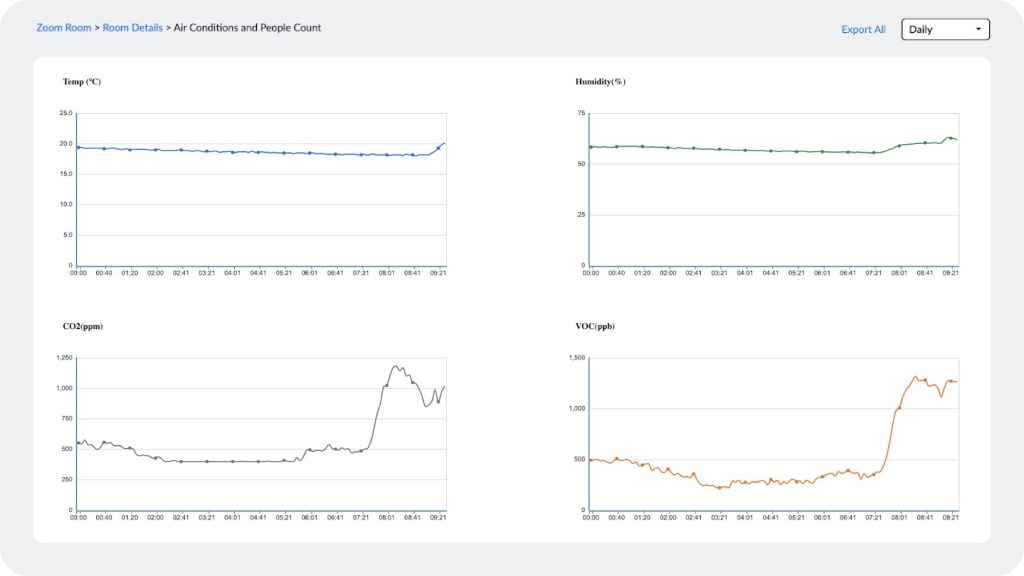
If you now click on the ‘View Details’ option, you will be able to view the graphs and refresh the data in real-time:
Accessing and using sensor data
Sensor data is sampled on each Neat device every second and pushed to the Neat Pulse cloud every 5 minutes. The only exception is the people count sensor, which updates the cloud within 10 seconds if occupancy changes. Learn more about or API rate limits here to optimize the way you fetch this data.
Sensor data is available at two levels:
- Device-Level: Returns sensor data specific to a single device.
- Room-Level: Aggregates data from all devices in the room. This is preferred for accurate environmental representation.
We generally recommend using the room-level data, as it offers a more accurate representation of the overall room environment.
Sensor data can be accessed through both Neat Pulse platform and the Neat Pulse web API. Data is always synchronized between the two. If you’re working with the API, see our documentation on rate limits to optimize how you fetch this data.
All Neat devices include the same set of sensors. Refer to the table below for a full overview, and check out this support article for more details on each sensor.
Platforms
Sensor data can be accessed through:
- Zoom Dashboard (for Zoom Room integrations)
- Neat Pulse Platform
- Neat Pulse Web API
Both Neat Pulse interfaces (management platform and API) provide synchronized data views.
API Access
There are three main methods to retrieve sensor data using the Neat Pulse Web API:
- GET endpointsSensorData
Retrieve data for an individual device using its unique ID. - GET endpointsBulkSensorData
Retrieve data for all devices within a Neat Pulse tenant using an organization ID. - GET roomsGetSensorData
Retrieve aggregated room-level data using a room ID. This is the recommended method as it provides a more accurate representation by combining data from all devices in the room.
Breakdown of sensors and measurements
Sensors per device
| Device | Model ID | Model ID |
|---|---|---|
| Neat Pad | A1 | 3D Accelerometer* Relative Humidity Temperature CO2eq VOC |
| Neat Bar | B1 | 3D Accelerometer* Relative Humidity Temperature CO2eq VOC Ambient Light People Count |
| Neat Board | C1 | Relative Humidity Temperature CO2eq VOC Ambient Light People Count |
| Neat Bar Pro | D1 | 3D Accelerometer* Relative Humidity Temperature VOC Index Ambient Light People Count |
| Neat Bar Gen 2 | E1 | 3D Accelerometer* Ambient Light People Count |
| Neat Frame | F1 | 3D Accelerometer* Relative Humidity Temperature VOC Index Ambient Light People Count |
| Neat Board 50 | H1 | 3D Accelerometer* Relative Humidity Temperature VOC Index Ambient Light People Count |
| Neat Board Pro | K1 | 3D Accelerometer* Relative Humidity Temperature VOC Index Ambient Light People Count |
| Neat Center | L1 | 6 axis Gyro+Accelerometer* People Count |
*Currently not exposed in the API
Details on measurements
| Measurement | Variable | Unit | Comment |
|---|---|---|---|
| Relative Humidity | humidity | Percentage (%) rH | |
| Temperature | temp | Degrees Celcius | |
| CO2eq | co2 | PPM | Includes greenhouse gasses beyond CO2 |
| VOC | voc | PPB | |
| VOC Index | vocindex | Scale 1-500 | Indexed against past 24h |
| Ambient Light | illumination | Lux (LX) | |
| People count | people | Integer | Updates in max 10s when a change is detected |
| Measurement | Min | Max | Comment |
|---|---|---|---|
| Relative Humidity | 20 | 100 | Accuracy: 3.5% in the 20-80% range |
| Temperature | – | – | Accuracy: ± 1°C in the +15 to +40 °C range |
| CO2eq | 400 | 60 000 | 400 ppm: normal outdoor air 400-1000 ppm: normal indoor air 1000-2000 ppm: bad indoor air quality 2000-5000 ppm: can cause headaches, drowsiness, fatigue, loss of focus, nausea >50000 ppm: toxicity, oxygen deprivation Accuracy: 15% |
| VOC | 0 | 60 000 | 0-400 ppb: good indoor air 400-800 ppb: additional ventilation required 800-2200 ppb: can cause headaches, nausea, dizziness, and irritation of the respiratory tract and eyes 2200-3000 ppb: unhealthy levels, exposure can be harmful Accuracy: 15% |
| VOC Index | 1 | 500 | <100 = less VOCs vs average 100 = normal >100 = more VOCs vs average |
| Ambient Light | 0 | – | 50 lx: dim light 10000 lx: bright light at noon |
| People count | 0 | – |
Zoom Dashboard Integration
For Zoom-integrated environments:
- Navigate to Zoom Dashboard > Zoom Rooms
- Select the room to view a summary of sensor data.
- Click “View Details” to access graphs and real-time data updates.
Sensor data is derived primarily from Neat Bar and Neat Board. Neat Pad currently does not report environmental sensor data to the Zoom cloud.
Important Considerations
- Neat devices must be powered on for at least 24 hours to ensure accurate environmental readings.
- Sensors can be influenced by nearby heat sources or restricted airflow.
- All data is pushed securely to cloud platforms and only aggregate, non-personal information (e.g., people count) is transmitted.